

Observe your Applications: Health checks and CPU/Memory consumption
Observe your Applications: Health checks and CPU/Memory consumption
Find out how you should setup your application monitoring in order to prevent failures on the application level.

This is second part of series regarding Observability on AWS. You can read first part here Observe your applications: Observability
Let’s recap what we want to have on our applications:
Monitor critical components
Track errors that happen in our apps
Make our customers happy
In this part we will be speaking more in depth about monitoring critical components.
Health checks
First thing first, in order to have proper monitoring of servers we need to have good health checks.
It can have few states, but most important ones when they fail are:
Application timeouts after certain time
Application returns 500 on API /health endpoint
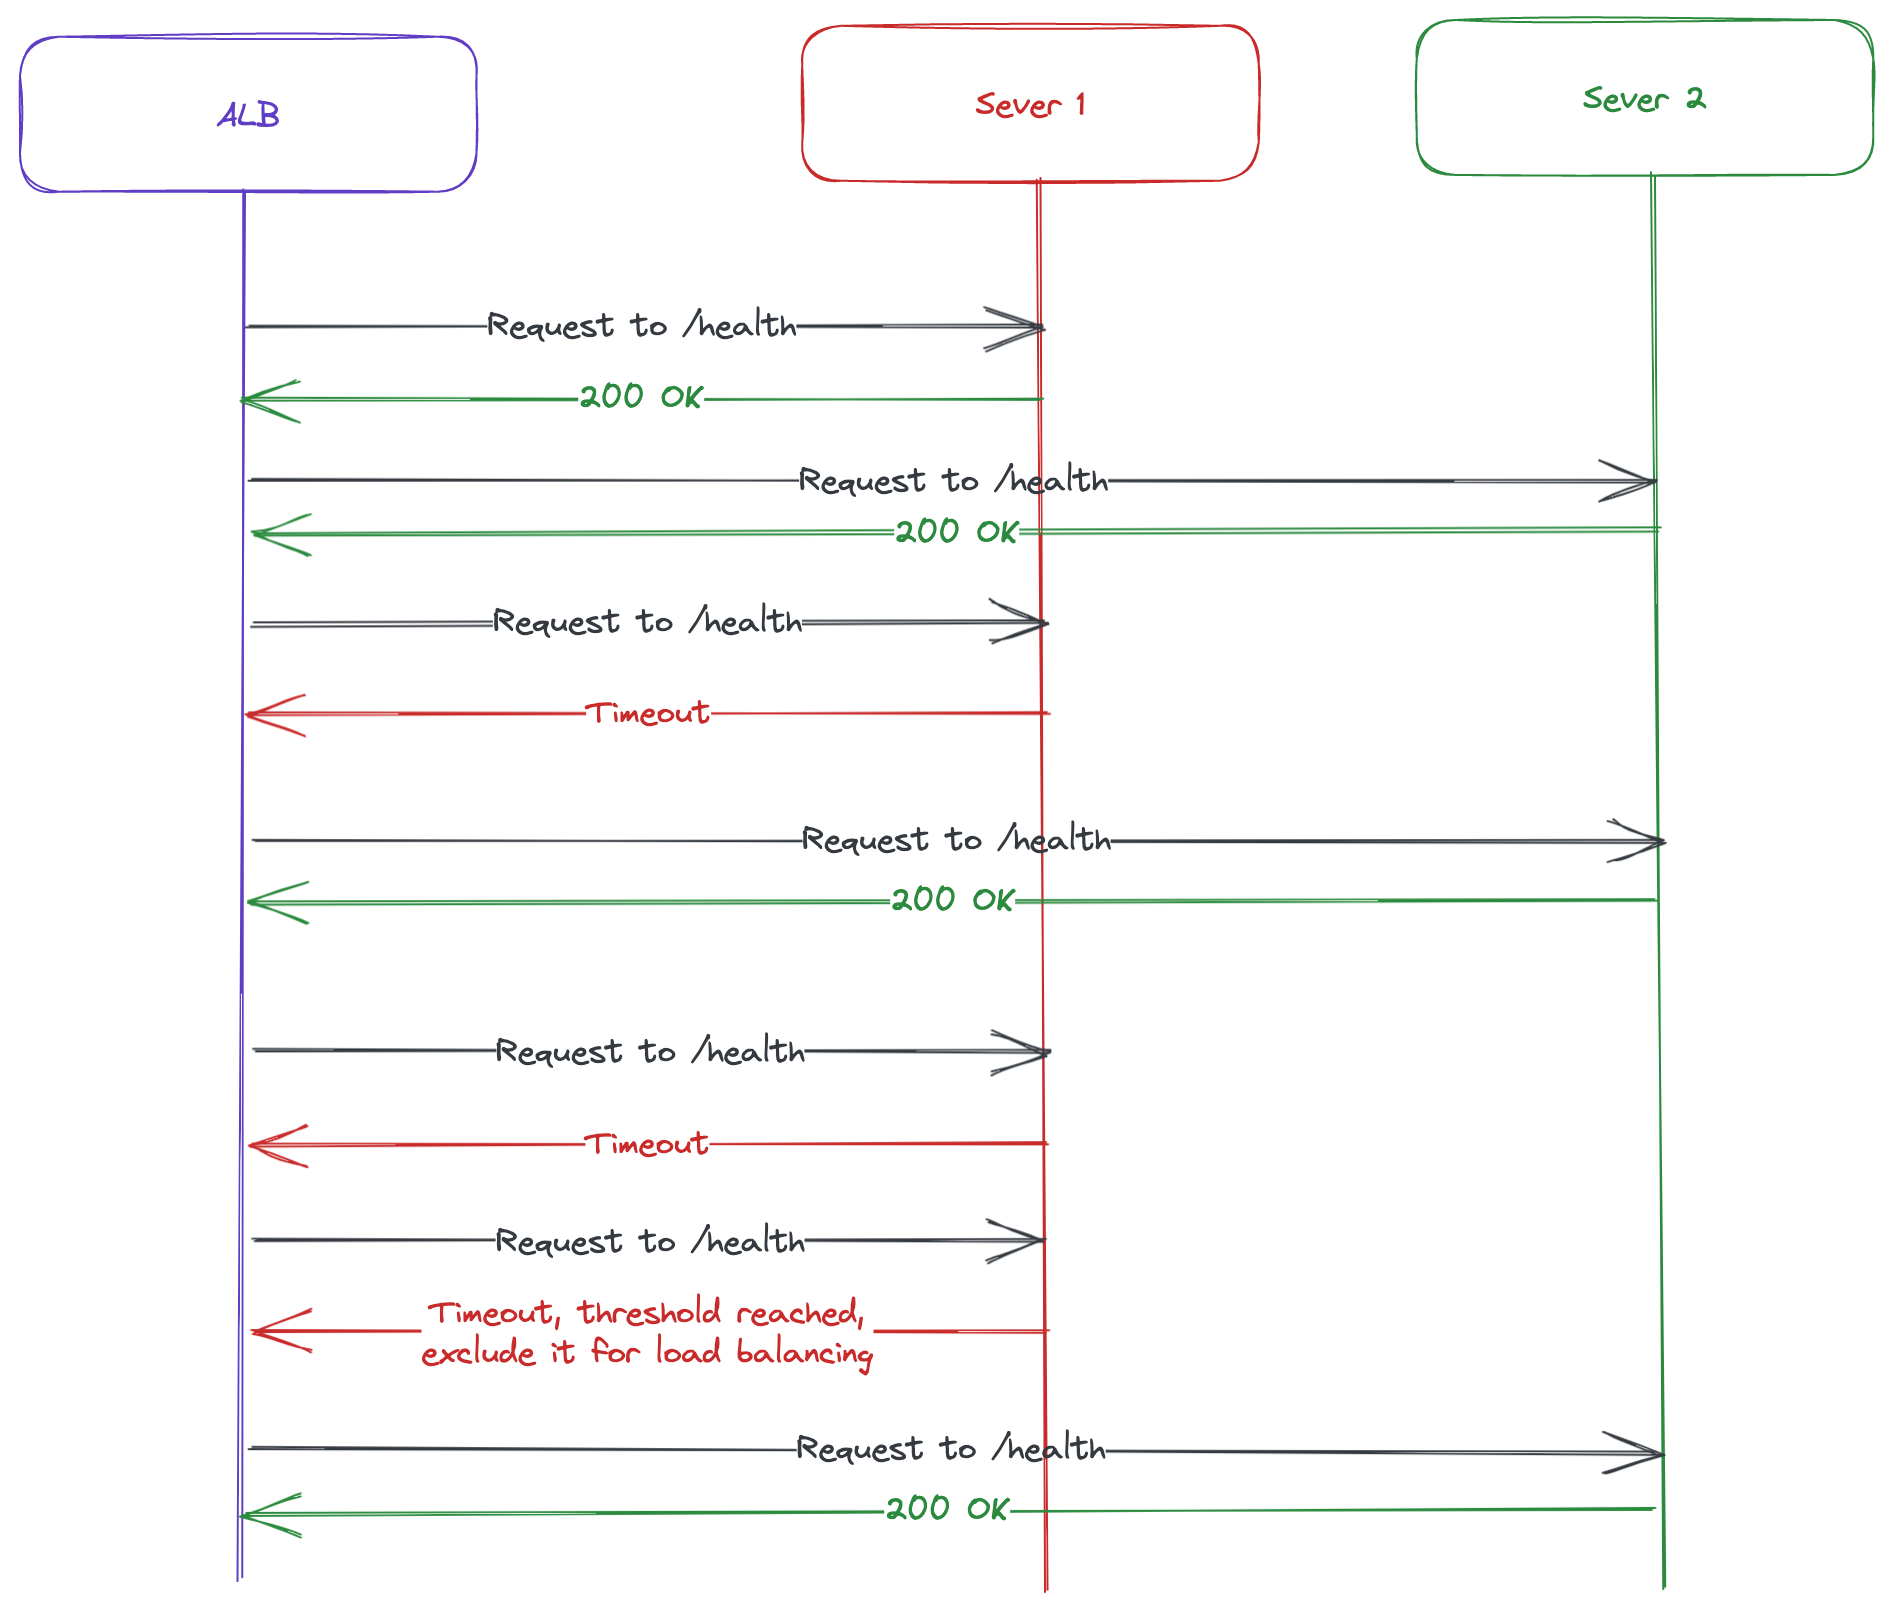
These health checks are important to allow Application Load Balancer to function properly and exclude broken servers from load balancing.
It has certain threshold which is configurable before instance is marked as unhealthy, this way if it fails for example 1 time it’s still ok until it reaches the threshold of repeated failures.
Based on these informations you can setup ALB in this way:
Create /health endpoint on your application which verifies that app is running. It shouldn’t just return 200 OK, you should check if it has connections to critical components for example and then return 200 OK.
Configure on Load Balancer what’s the response time you expect from /health endpoint before you consider it failed health checks. This ways it will exclude servers from load balancing if they are overloaded and responding slowly, when they recover they start getting new traffic.
Default threshold before it’s marked as unhealthy is 5, so if you decide you can change it to different number between 2-10.
When you have proper health checks it will allow you to route traffic to instances which can handle the traffic.
With CloudWatch you can monitor number of unhealthy instances in your target group. This way, you can setup proper alarms when number of unhealthy instances starts to grow and it looks like ALB won’t be able to route traffic to anything.
Raising these types of incidents to incident management tool is important because it can be more serious issue and some service might be down, which is taking down your application eventually.
CloudWatch can get metrics for UnHealthyHostCount which on ALB indicates how many targets are considered to be unhealthy. And based on this you can setup Alarm which notifies something like PagerDuty and engineer can intervene.
CPU/Memory consumption
This one is important to me measured and perform autoscaling based on the consumption. You can setup multiple things regarding this:
Notify on-call engineer when it reaches certain threshold and keeps it there for period of them
Perform autoscaling based on the cpu/memory consumption
How it’s done on AWS is by using CloudWatch and setting correct alarms when you are working with Auto Scaling groups.
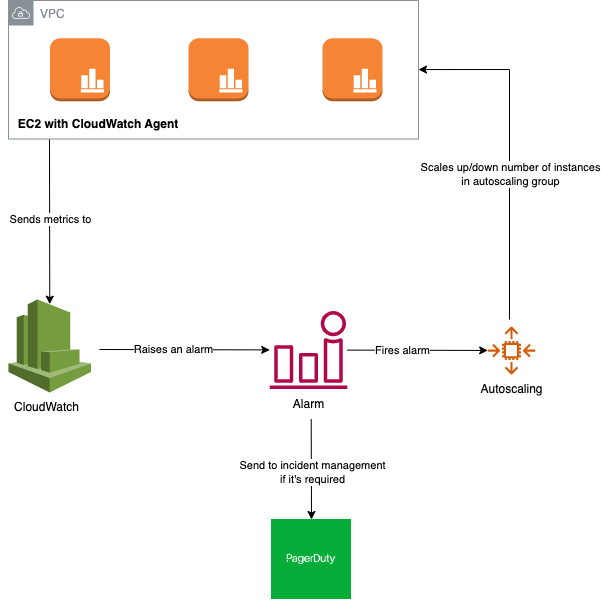
This is done on AWS using couple of things:
Autoscaling group, it handles number of instances that we want to have in the group, and manages to keep them running all the time. It has different scaling policies like:
Step scaling - scales depending on the breach of threshold. For example, scale by one instance if the CPU/Memory is at 60% of usage, and scale by two instances if the CPU/Memory is at 90% of the instance. This gives your more control to react properly and scale before it reaches to final limit.
Simple scaling - scales number of instances based on one amount that’s it. You don’t have the control your would otherwise have in Step Scaling.
CloudWatch, which we leverage to collect all metrics and fires alarms when things reach certain limit for a period of time.
It’s important to raise incidents to the incident management tools in case most of your instances are overloaded for period of time, that way somebody can intervene. Because in those cases you might have bigger problem and you will reach maximum in your autoscaling and application will fail eventually if scaling doesn’t help it to handle the traffic.
Based on all of this, manual interventions is the last thing you should go for, but you want to be able to know when it’s happening rather than just assuming Autoscaling/Health checks would handle it. All of these can indicate that you have a bigger problem on your application which is causing the issue.
Thank you for reading, we will go into other things about Observability and Fault Tolerance in future posts, and eventually we will cover something like ELK stack for monitoring.